
A Remedy for the Unaligned Multispectral Imagery Blues
By Chad Belisle on 2020-04-03 01:00
The following contains two tutorials on how to register (align) multispectral imagery bands into a single composite raster image. This would be suitable for those whom have come across the issue of having captured a single image using a multispectral sensor and now are forced to find a technique to register the images manually.

Lucky for us, we have been rather well trained during the ADGIS program here at Selkirk College to overcome logistical GIS challenges. When one workflow doesn't work, find or create another. Sometimes coming up with solutions to software related issues can be easy, sometimes not so much. Being a COOP student at the SGRC not only provides the space, tools and time to assist in researching solutions, but also provides a physical platform where students and researchers can brainstorm ideas together.
Below are two methods that give similar results, both with their own pros and cons. The first one, I created and requires an ArcGIS Pro licence and some patience. The second one, I found online and requires some Python/Command Line abilities, however is FREE and relatively fast.
Method 1: Aligning Multispectral Imagery Using ArcGIS Pro
Multispectral images can be referenced or aligned to one another in ArcGIS Pro, piggy backing off the georeference function. This is quite tedious and repetitive; if you have multiple sets of images to align, and you know how to use Python/Command Line, I suggest skipping to Method 2.
Steps to Align Four Band Images and Create Composite Multiband Rasters:
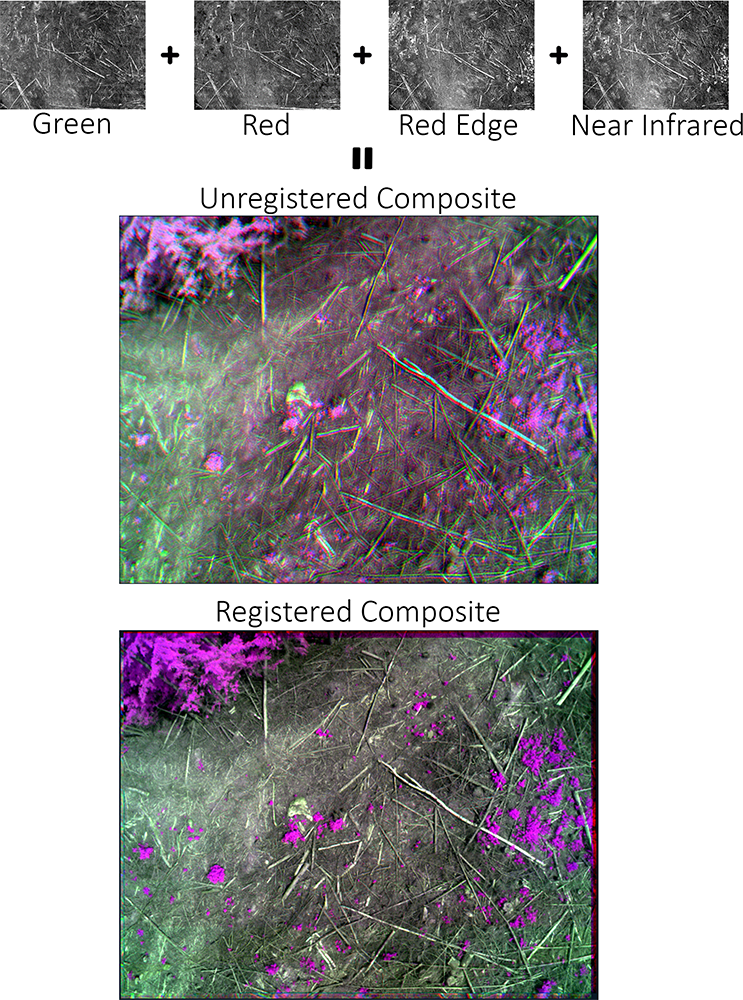
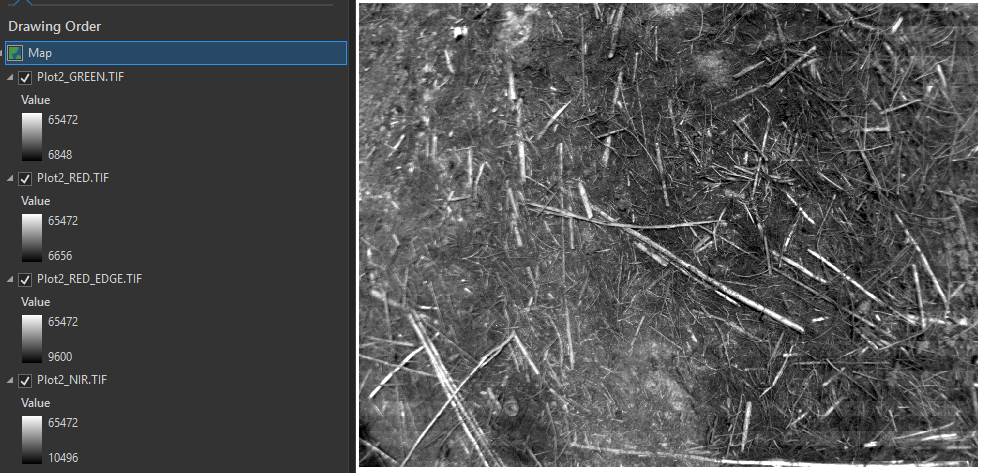
1. Load all four separate images into ArcGIS Pro that contain the corresponding Green, Red, Red Edge and NIR bands from the image set.
2. Highlight in the Table of Contents (TOC) a single band image to reference (this will be the source image, the image that you want to reference to another image)
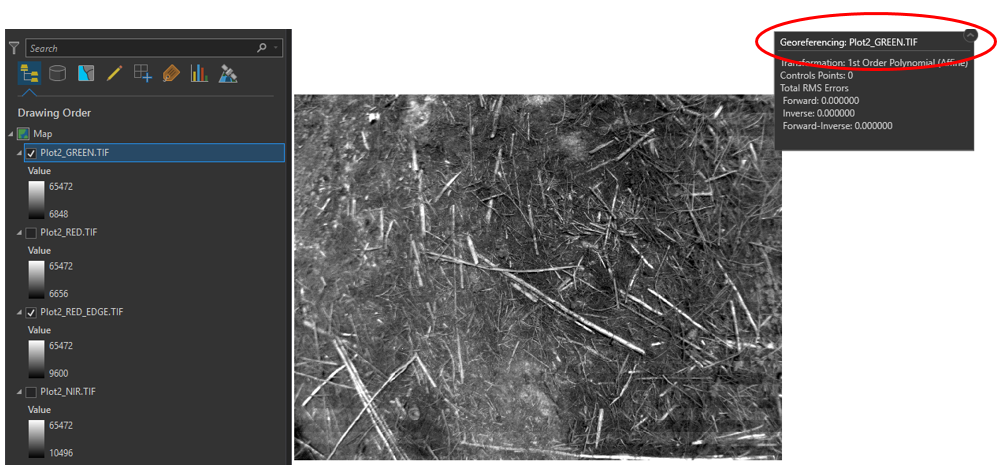 3. Open Georeference from the Imagery tab (remember which ever image is
selected in the TOC will be the source image) (Green band has been used
as the source image)
3. Open Georeference from the Imagery tab (remember which ever image is
selected in the TOC will be the source image) (Green band has been used
as the source image)
4. Ensure only one other band from the image set is visible ie. selected (checked on) in TOC (this is the target image, and will be used to reference all the images in the set, in this case we want to reference all the images to the Red Edge band image, so ensure only the Red Edge and Green bands are selected)

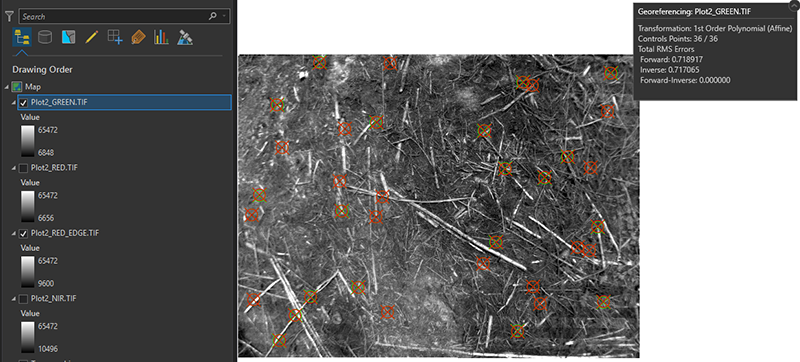
5. Press auto georeference, the source image (Green) will align to the target image (Red Edge) based on spectral signatures of 36 automatically selected control points. (Note: this can be done manually as well by selecting common visible control points between the two images, but can be extremely time consuming)

6. Save. This will either overwrite or save a new copy of the now referenced (to Red Edge) Green image.
7. Repeat steps 1-6 for the other two band images ensuring the target image (Red Edge) is used each time. (Note: Because you are using one of the bands as the target image, only 3 auto georeferences need to occur.)
Also Note: This process only references the images to one another for stacking purposes, once combined into a multiband composite image they can be further georeferenced to actual ground coordinates.
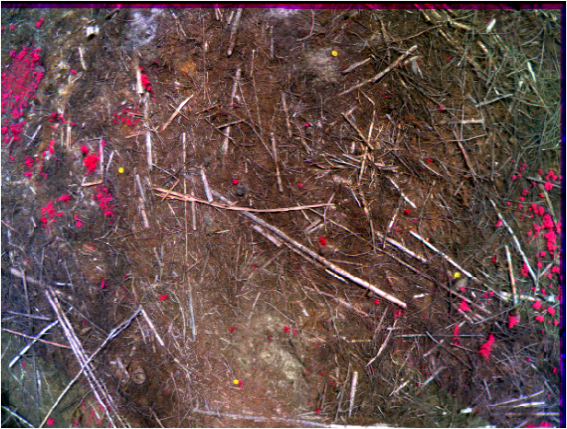
8. Once the Green, Red, and NIR band images have been referenced to the source image (Red Edge), we can now select the Composite Bands Geoprocessing Tool, which will stack up to all four aligned band images and create a multiband raster. This raster can now be used in remote sensing applications to solve complex problems! Shown to the right is a common false colour composite RGB image where NIR is displayed as Red, Red is displayed as Green and Green is displayed as Blue, but most importantly, the images are aligned!
Method 2: Aligning Multispectral Imagery Using the Sequoia Stacking Python Script
This method is FAST and requires nothing more than an open source Python script and some package add-ons. This script can be run on a directory and it will automatically create 3 band false color RGB composite images which can be used directly for remote sensing applications. (Note: This is only for images created with the Parrot Sequoia, if you've used another sensor, this method may not work.)
The Sequoia Stacking script and directions can be found here. Below is the directions from Tyler Pubben's[ ]{.ul}github page, along with some added text from me to help you along the way.
To Use:
1. Install your preferred Python 3.x distribution. You need the following libraries: a. OpenCV3.4 with the contrib packages for SIFT (keep in mind, SIFT is a patented algorithm. Please do not place this into a commercial software package. b. numpy
One way of installing package add-ons is using pip install
- Pip comes preinstalled with newer Python 3.x distributions, you may need to install pip first though if you have an older version
- Numpy comes preinstalled with newer Python 3.x distributions, if
you need to install numpy:
- 'pip install numpy' -- run this in a command prompt
- Open CV3.4 can be pip installed into Python. Both these need to be
installed in order to work:
- 'pip install opencv-python==3.4.2.16' -- run this in a command prompt
- 'pip install opencv-contrib-python==3.4.2.16' -- run this in a command prompt
2. Copy all of the Parrot Sequoia individual band images into a single folder.
- These should all have default factory names
- Four images with the same name and the spectral band name
suffix
- Ie. Plot2_GRE, Plot2_RED, Plot3_REG, Plot2_NIR
- Four images with the same name and the spectral band name
suffix
3. Create an output folder where you want your composite images to be saved.
4. Run the script - the way you do this varies based on OS and installation. If you don't know how to run a Python script from terminal I suggest you look at an introductory Python course.
- If you've made it this far, you probably know how to run the script..
5. When the script prompts you for which band you want in each channel keep in mind that channel 1 == blue, channel 2 == green and channel 3 == red in the false color composite.
Note: This is backwards from most remote sensing software, usually it is RGB not BGR
- Depending on your project needs you may need to create an image
that displays specific information.
- To showcase the infrared properties of vegetation, a logical
display order would be
- Channel 1==blue (green band)
- Channel 2==green (red band)
- Channel 3==red (NIR band)
- To showcase the infrared properties of vegetation, a logical
display order would be
6. Enter the full path to the output and input folders. eg. "C:\Users<username>\inputFolder" the quotes are not necessary.

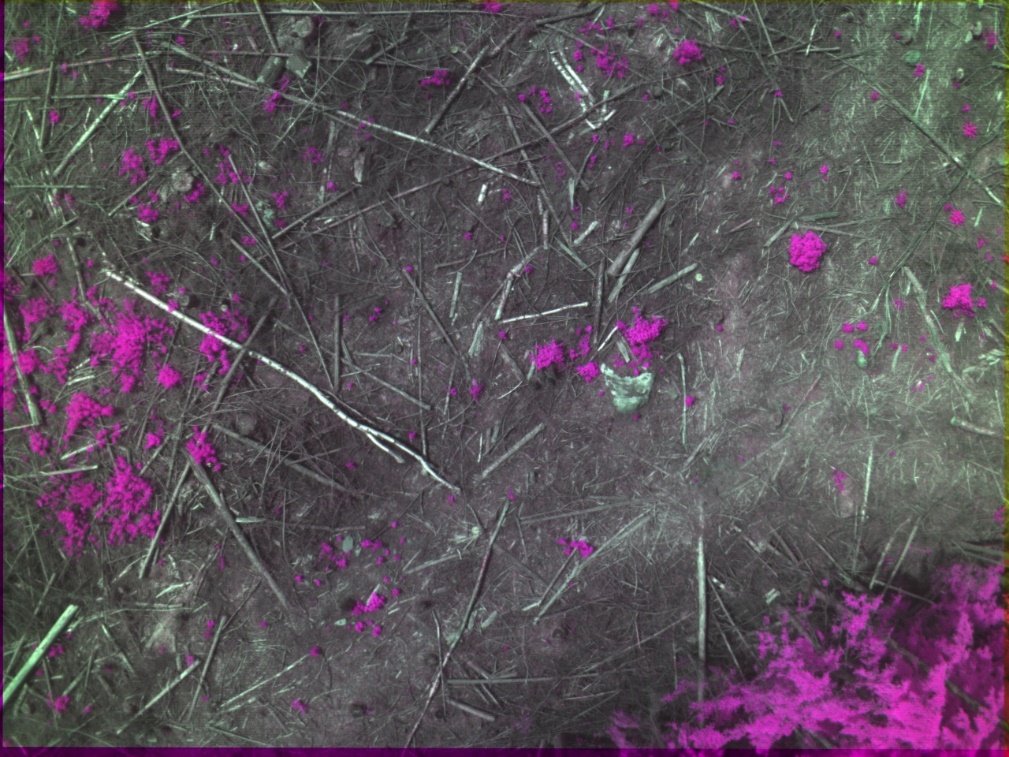
After the script runs the image will be deposited in the output folder.