Mapping Potential Agricultural Areas with Remote Sensing
By Kailee Woodbeck on 2015-04-20 19:29
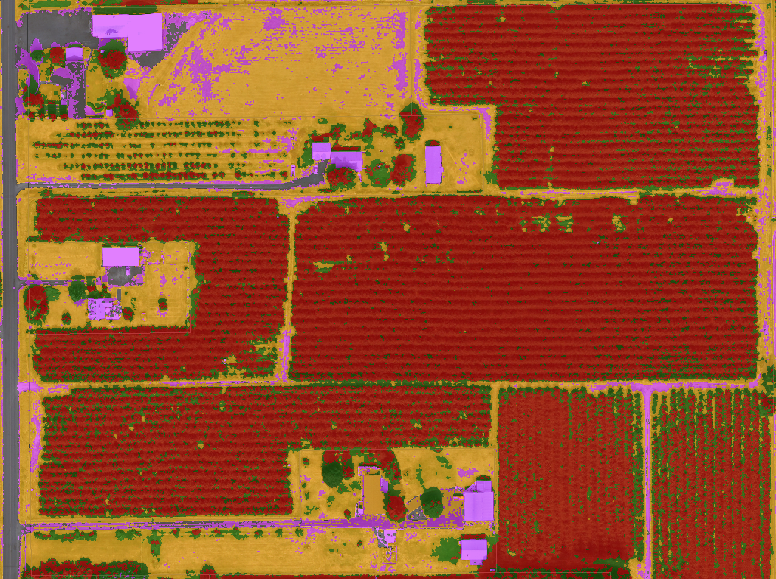
Supervised classification results of orchards and farmland.
The goal of this project was to find potential agricultural areas in Creston Valley that were not currently being used for farming.
The imagery utilized for this project was 30 metre Landsat 8 satellite imagery and 20cm fixed wing captured aerial photography. The satellite imagery was downloaded from this awesome Landsat Image Browser for June to September of 2013 and 2014. The fixed wing aerial photography was obtained from the Regional District of the Central Kootenay (RDCK) for 2012.
Landsat 8 Analysis
To determine pixels with live vegetation, Normalized Difference Vegetation Index (NDVI) was calculated. The NDVI results were reclassed to eliminate all non vegetation pixel values (ie. water, rock, roads, buildings etc). The results were then combined to create one raster for each year that contained the maximum NDVI value for each pixel.

Combined NDVI results of live vegetation for 2014 Landsat Imagery showing light to dark green as low to high NDVI values.
The next step was to determine what was causing low/ high NDVI values across the results. Zonal statistics for each parcel of land were calculated from the NDVI results. From the zonal statistics results, hot spot analysis was performed to determine any spatial relation of the NDVI values.

Hotspot Analysis results showing blue as lower NDVI values and red as higher NDVI values for each parcel.
It was evident from the hotspot analysis results that there was clustering of areas with low/ high NDVI values. Regression analysis was run on the resulting zonal statistics against several variables including type of farm, soil type, elevation and slope to try to explain the NDVI value clustering, A statistically significant relationship for low NDVI values was identified between rockier soil types and orchards.
Using ENVI’s** change detection** tool, the NDVI results from 2013 to 2014 were compared. The results showed a 1-50% reduction in high NDVI values on 55% of the scene.

Change detection results showing blue where NDVI values increased from 2013 to 2014 and orange where values decreased in the same timeframe.
Aerial Photography Analysis
The 20cm resolution imagery was used to run higher level analysis. Several classification algorithms were run on the imagery including Supervised, ISO Mean and Maximum Likelihood.

Supervised’ classification results of orchards and farmland.
Potential farm areas were determined by joining the parcel fabric for the region to BC Assessment’s primary actual use codes. Properties whose primary actual use was farm, commercial, industry or civic were eliminated from the area of potential farms. Parcels that had too little of pixels classed as ‘orchards’ or ‘farmland’ were also eliminated from the potential farm area.
From the area classified in the Creston Valley, 25% was determined to be potential agricultural area.
What this all means...
Landsat 8 and NDVI analysis definitely has the potential to provide coarse level information on live vegetation in a region. There is the potential for even identifying variables that are influencing low and high vegetation amounts.
With higher resolution imagery, accurately classifying farm land and orchards is definitely possible. Since the classification algorithms used for this project were spectral based, there was some error in the results (eg.forest classed as orchards). These errors could easily be reduced with object oriented classification, which would allow for patterns along with the spectral signature of the surrounding pixel values to create meaningful objects for classification.
Software used: ArcGIS 10.2, ENVI 5.0, Excel 2010
Interested in learning more? Please contact us for more info!