
Object Classification using Spectral Signatures
By Colin Jaeck on 2019-08-12 07:00
When I began working for the SGRC, I was given the task of analyzing multi-spectral drone imagery from cutblocks. The objective was to provide Government and industry partners with an accurate means of assessing biomass quantities left behind from logging operations.
The process requires the use of specialized software and remotely piloted aircraft systems (RPAs) to classify materials on the ground. An integral component of the classification is differentiating between spectral signatures of different materials. This post gives a brief overview of what spectral signatures are and how we use them in GIS.
Visualizing the invisible
The amount of detail we are able to perceive is limited by our biology. We only hear sounds that fall within a certain frequency. We cannot taste or smell substances unless enough particles of that material are present. Our eyes see the world filtered through a narrow range of the electromagnetic spectrum. GIS Analysists and many others rely on technology to augment their senses and uncover hidden truths.
Here at the SGRC, we use specialized programs to process and classify multi-spectral drone and satellite imagery. A multispectral image has captured data across the electromagnetic spectrum and is not limited to visible (RBG) wavelengths. Classification workflows on multispectral data involve assigning classes to objects based on their unique spectral signatures.
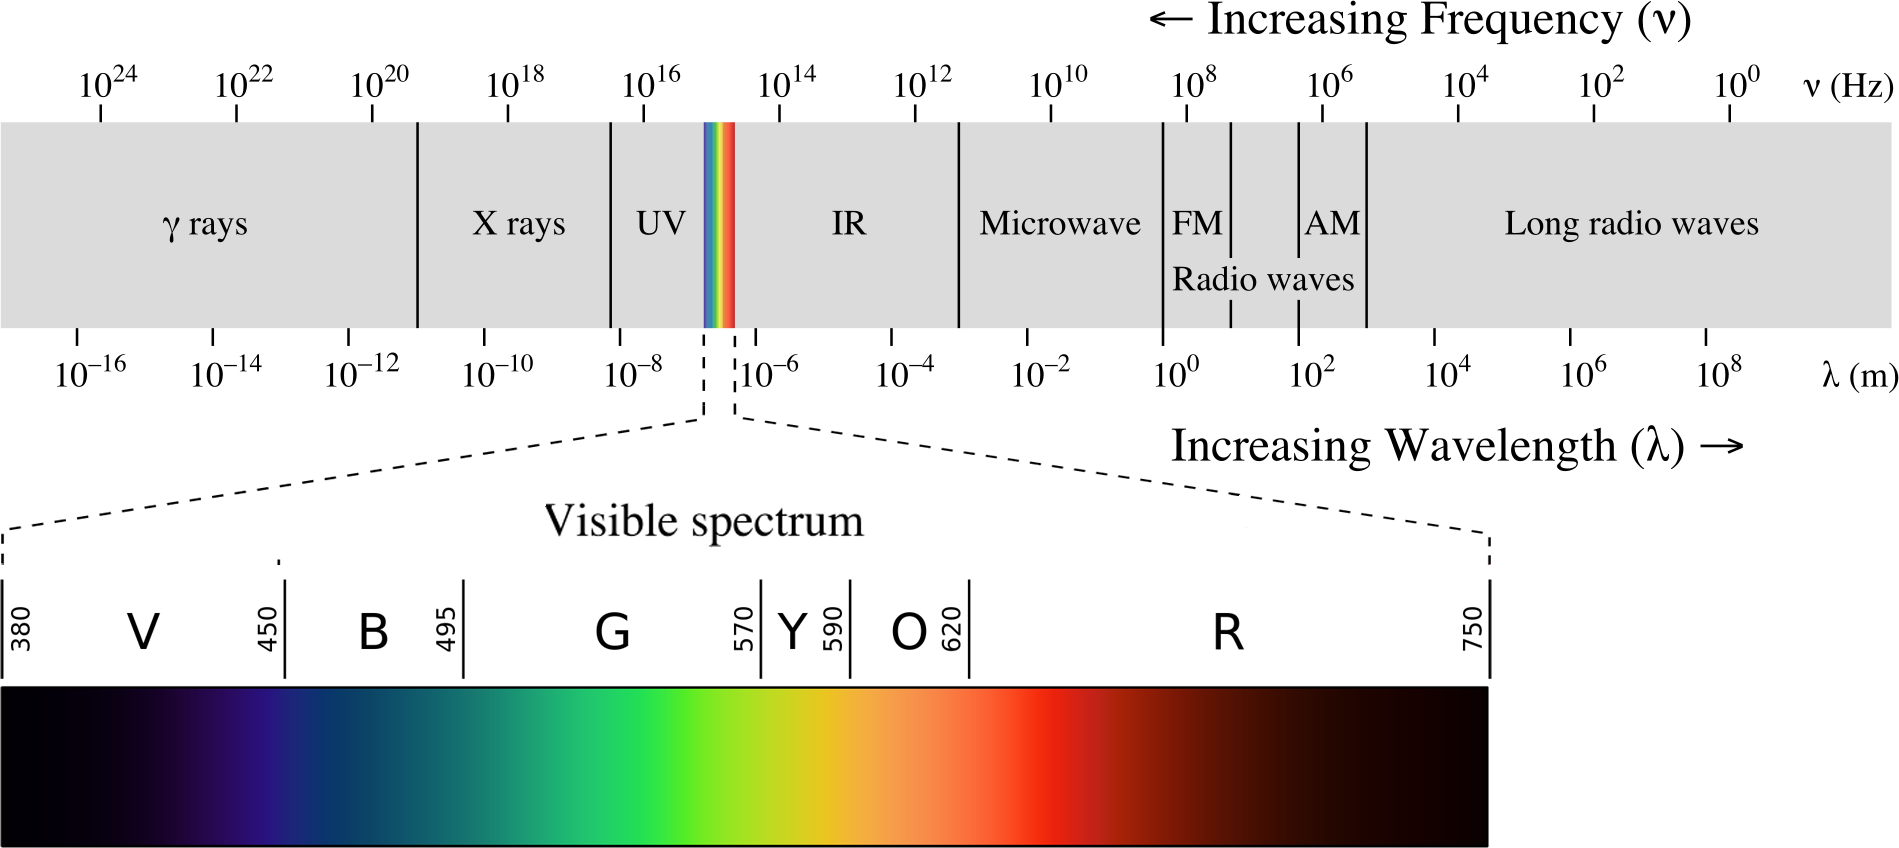
The Electromagnetic Spectrum encompasses all forms of visible and invisible light. Credit: Philip Ronan, Gringer – License link: Attribution-ShareAlike 3.0 Unported
So what are spectral signatures and why are they so useful?
All materials on the earth have unique spectral characteristics. To put it another way, all materials reflect and absorb sunlight differently. In remote sensing we concern ourselves with how various materials interact with these different wavelengths. Deploying multi-spectral sensors allows us to form a more complete picture that isn’t constrained by our biology. They are capable of measuring reflection and absorption of different materials within various wavelengths of light. The way different wavelengths are reflected or absorbed on various materials can be measured. We exploit these measurements to extract information about an object or region. This is incredibly effective, particularly when utilizing both visible and invisible wavelengths.
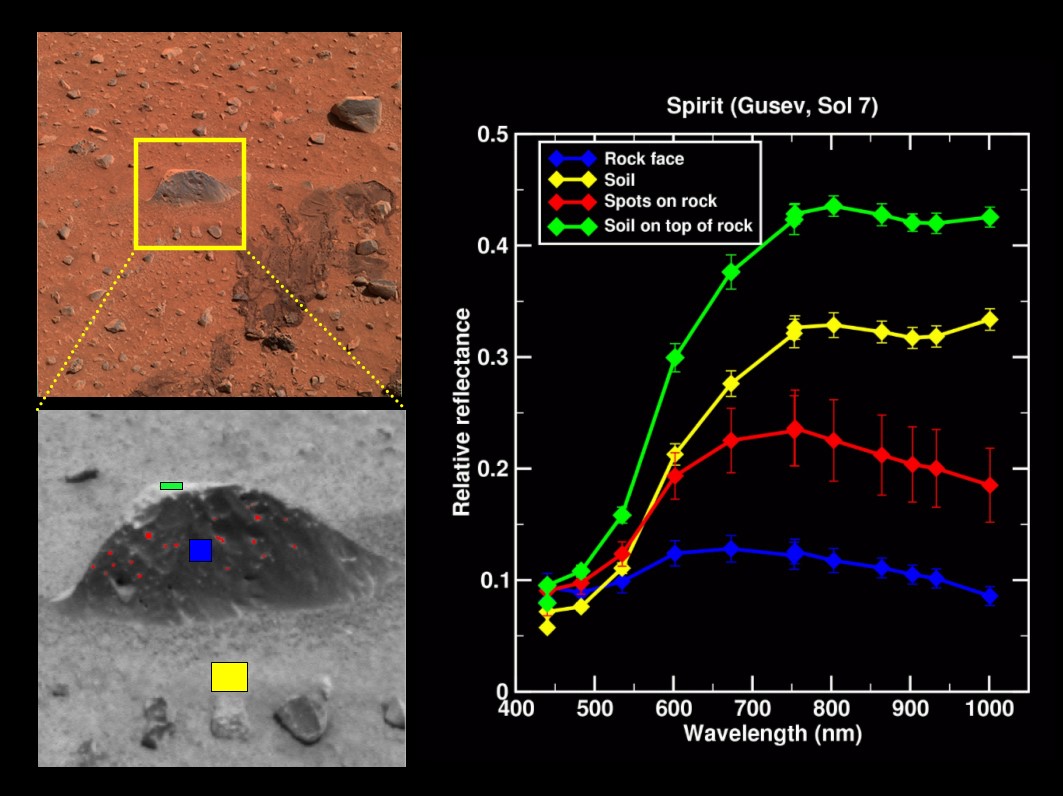
Different spectral profiles on and around a single Martian rock. Credit: NASA Pathfinder Mission – Link: Mars Pathfinder - Science Data from Press Conferences
Vegetation, for example, has specific characteristics which make it easy to identify using the Near-Infrared (NIR) wavelength, a region just outside of visible light on the electromagnetic spectrum. While a tree may appear green to us (absorbing the red and blue wavelengths for photosynthesis and reflecting green), NIR is also reflected, but only visible to multi-spectral sensors (and frogs!). A tree with a high chlorophyll content readily reflects NIR. An unhealthy tree on the other hand will still reflect NIR, but with less intensity. These interactions allow us to quantify NIR reflection / absorption and determine the general health or growth stage of that tree. We can even identify stressed or infested vegetation before it’s visible to the naked eye. Unique patterns of absorption / reflection also allow for species differentiation. All of this makes accurate, large scale land-cover classification possible without ever venturing into the field.
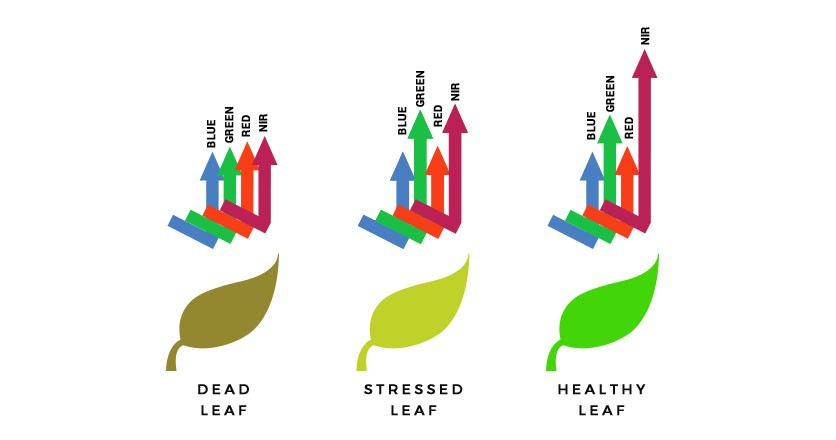
How different wavelengths of light are reflected from a leaf in various stages of health. Credit: Altavian Unmanned Aircraft Systems – Link: What is CIR Imagery and what is it used for?
While NIR is useful for vegetation, each region on the electromagnetic spectrum has different applications. Blue, for example, is useful for deep water penetration and is often used to map aquatic plants or marine populations. Red is useful for determining soil types or differentiating natural features, from man-made features. Short Wave Infrared (SWIR) helps evaluate moisture content and is also used for mineral exploration. These are just a few examples.
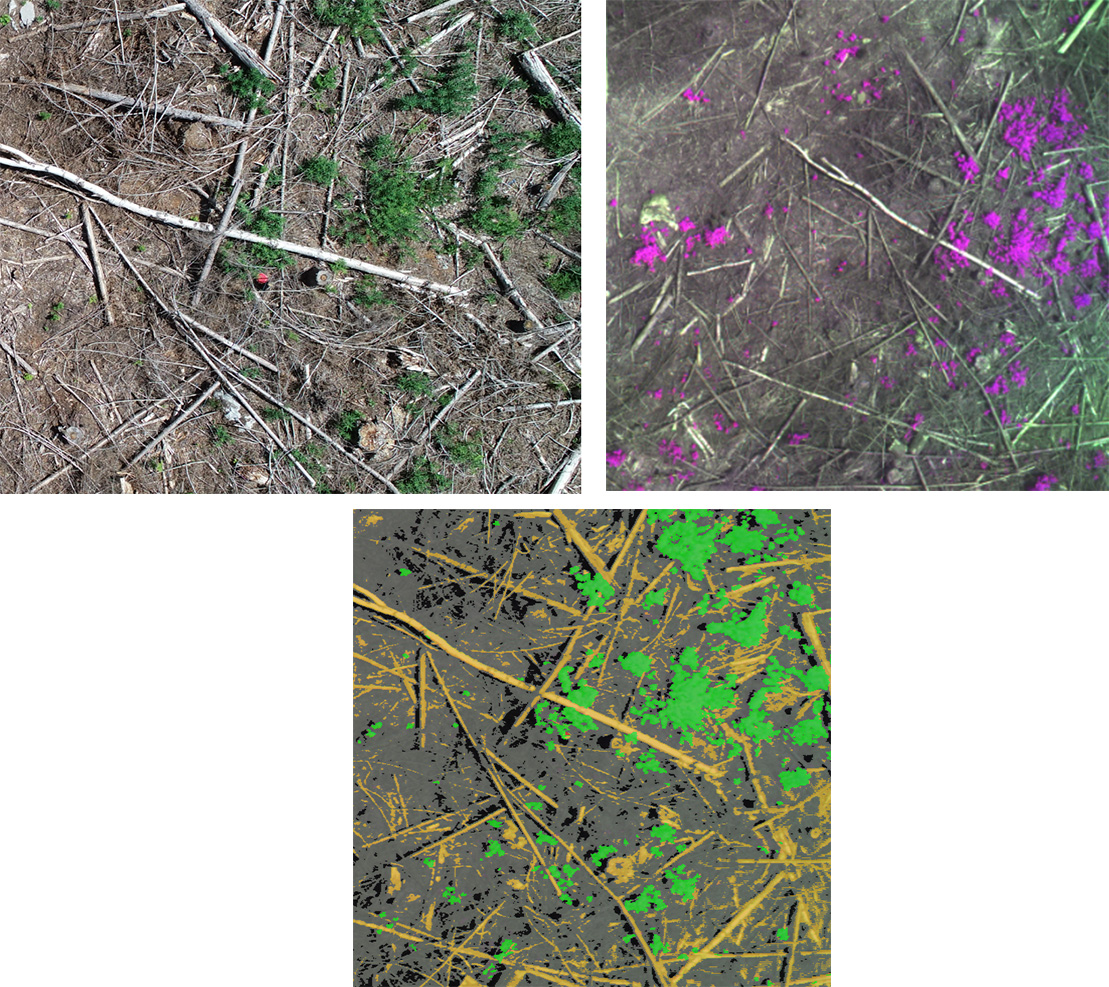
Left: Raw drone image. Middle: Purple assigned to the NIR wavelength. Right: Classified image…Wood, shadows, ground and vegetation….This is a simple example from our work at the SGRC which demonstrates how well different wavelengths help visualize materials. In this case, all vegetation within a cutblock has been classified based on its NIR reflective properties. Wood, shadows and ground have also been roughly classified based on their specific spectral characteristics (not necessarily NIR). This analysis has not taken shape, texture, pattern or size into account, meaning all of these objects have been assigned to a class based on reflectance values alone. A more complete classification would consider all these factors together.
So which wavelengths (bands) should be used in your analysis? This is determined by the material you are attempting to identify and the sensor being used. If satellite imagery is being used, you can reference a list of all Earth observing satellite missions and their respective sensors at: eoPortal - Complete List of Earth Observation Satellite Missions. The United States Geological Survey (USGS) has compiled a list of the spectral characteristics of many different materials. This can be accessed by using the Spectral Characteristics Viewer. Additionally, gisgeography.com has a Spectral Signature Cheat Sheet which identifies different bands, their wavelength and their typical applications. Combining your chosen wavelengths and compiling them into a single image can result in detailed, accurate and often beautiful classifications, as seen in this NASA image of Western Australia…..
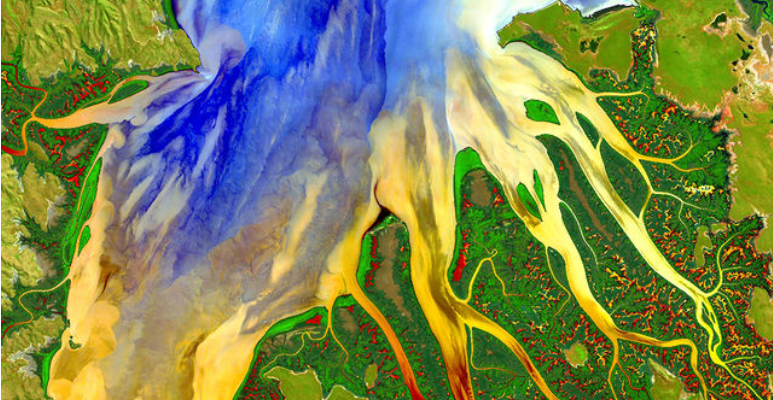
Compiled image created using data from NASA’s Landsat-8 satellite. “Enhancing various portions of the image captured in different wavelengths and then reassembling them highlights the rich sediment and nutrient patterns in a tropical estuary area and makes complex patterns and conditions in vegetated areas more visible and distinguishable.” Credit: NASA/USGS Landsat; Geoscience Australia – Link: Using Light to Study Planets
Additionally, a hyperspectral sensor, with a higher spectral resolution is capable of detecting very narrow regions of the electromagnetic spectrum (hundreds or thousands of different bands). Therefore, we can identify a greater diversity of materials. In the mining industry, this is useful for identifying the thousands of different minerals found on earth’s surface. Since each mineral has a unique spectral profile, choosing these bands appropriately allows for the identification of regions where a certain mineral is present. NASA has even deployed sensors with high spectral resolutions to map the mineral composition of other planets.
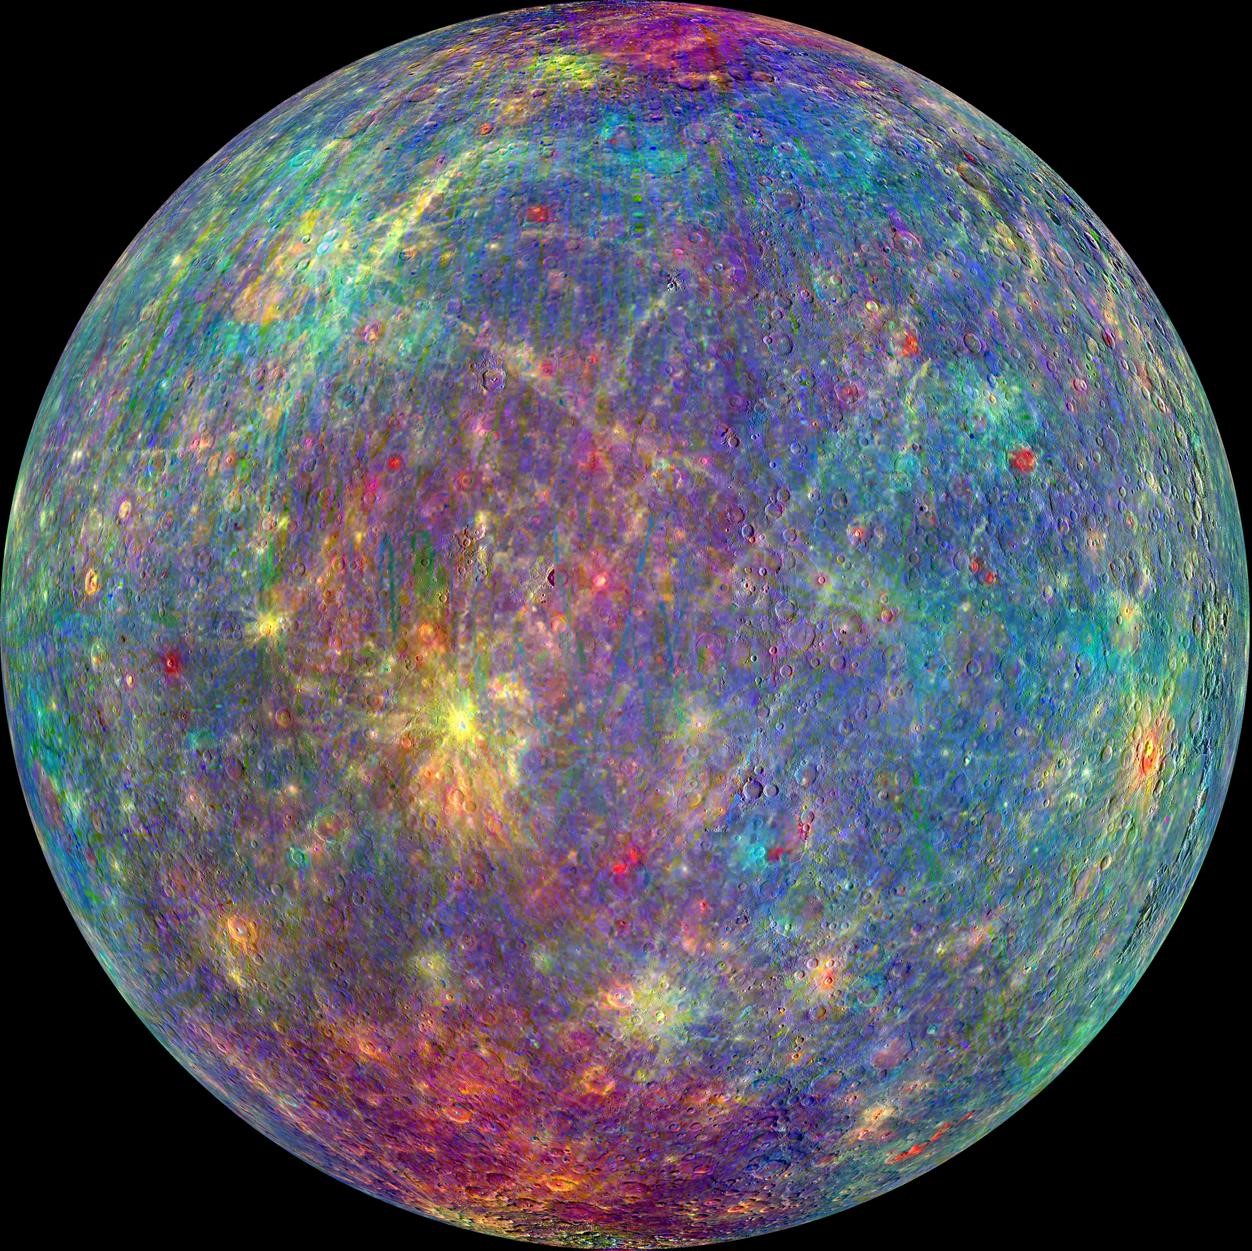
NASA's MESSENGER spacecraft uses spectral data to highlight various minerals and features on Mercury. Credit: NASA/Johns Hopkins University Applied Physics Laboratory/Carnegie Institution of Washington – Link: Unmasking the Secrets of Mercury
Forming the complete picture
Depending on the task, measuring reflectance may be all that’s required. Combining reflective properties with shape, size, pattern texture and association attributes can form an even more accurate result, proving useful in numerous applications. The correct use of image processing / classification software such as ENVI or eCognition is also very important and deserves its own post. For now, you can find a list of these different programs and their uses at: https://en.wikipedia.org/wiki/Remote_sensing_software