Everybody Does Data Differently
By Jessica Fulcher on 2018-09-24 22:11
I was hired with the SGRC to work on their Open Data for Open Government Project. This is a three year project exploring open data best practices, policy and delivery option in a rural setting (please visit this website for more information https://www.ruralopendata.ca/). I was excited about this opportunity. One of the main themes I pulled out of my coursework during the ADGIS program was the importance of the availability and usability of data.
In the beginning of my co-op, mapping projects were being requested. I was lucky to be asked to work on these as they gave me the opportunity to apply cartographic techniques I had learnt during my coursework. They also gave me the opportunity to expand my experience using ArcMap’s labelling and layout tools. More importantly, I worked closely with clients to craft the maps that they had in mind. Sometimes I would spend time working on an aspect of a map that in the end was taken off completely. This was a great experience, it helped me build the professionalism necessary to foster positive relationships with clients.
Maps are an amazing tool for visualizing data. It can be very exciting to take data from a spreadsheet and represent it on a map. Often, there is also a need to take hard copy data and transform it into digital data.
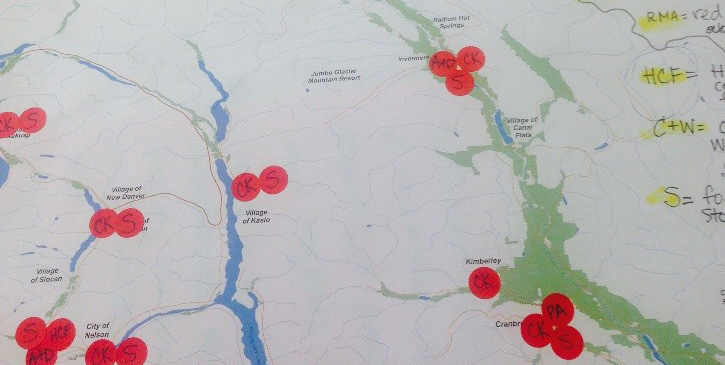
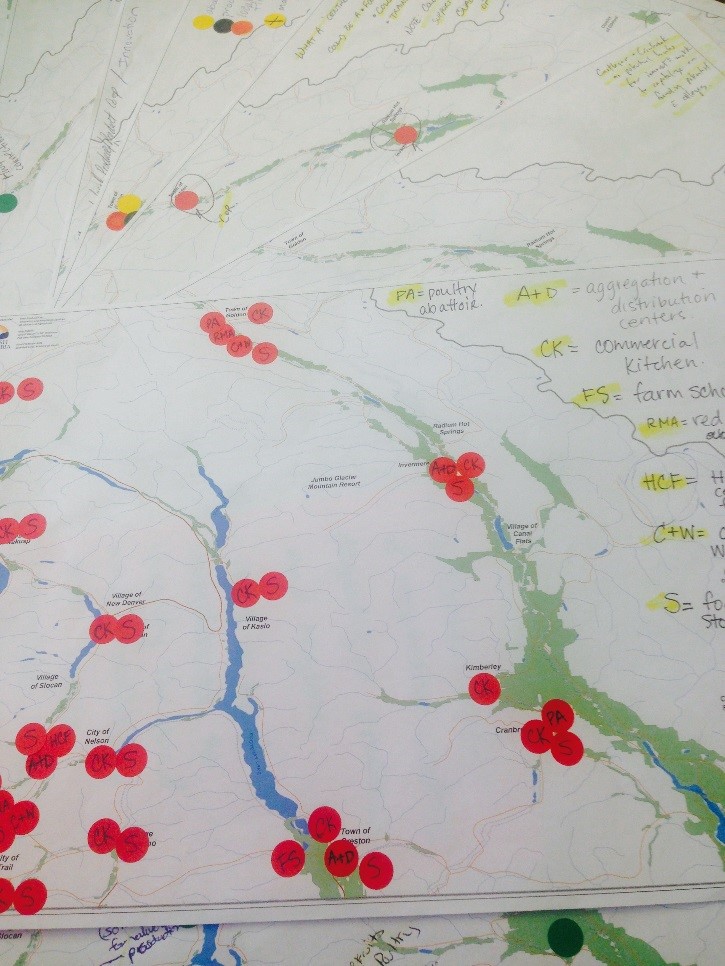
This can come in a range of different complexity levels from digitizing roads and streams from old paper maps to literally just putting people’s ideas on a map. I was able to work on a project for the Columbia Basin Trust that required the latter. They wanted a map that showed the brainstorming that had occurred at their Agriculture Forum. During the 2 day forum, the participants were provided with paper maps and asked to indicate what enterprise/innovation centres could be developed and where might they live. People that participated in the forum were residents of the basin that grow or raise food, are food system supporters, or are directly linked to the food system as retailers, butchers, restaurateurs, or abattoirs.
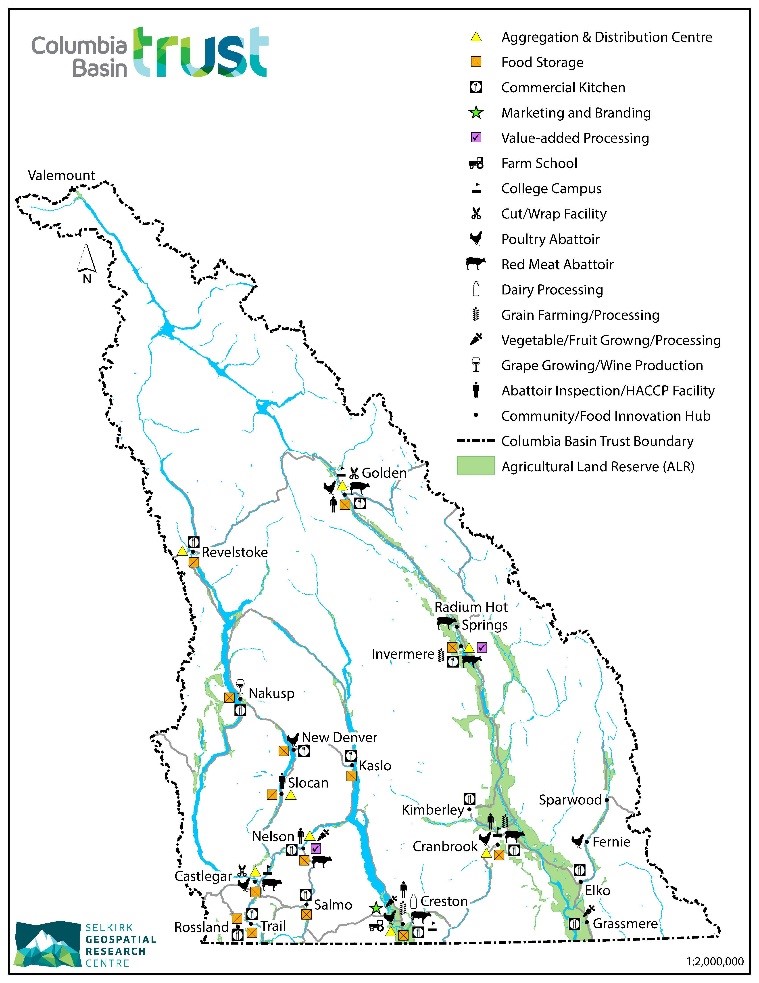
At first, when I saw a pile of over 10 hard copy maps covered in post it notes, stickers, handwritten notes, and makeshift legends I thought I had entered a GIS nightmare. However, after some helpful discussion with the Columbia Basin’s Agriculture Manager, Bree Seabrook, and my supervisor, Ian Parfitt, I was able to produce the map you see below. This mapping project may not display a high level of detail or accuracy, but it speaks to the power of data visualization. By using representative symbols I was able to put people’s thoughts from ten maps onto one map! This is a simple way to represent the transformation of hard copy data into digital data…and I thinks its pretty fun to look at as well.
Previous to my enrollment in the ADGIS program, my comprehension of the world of data was fairly limited. I knew people collected it, I myself had used survey equipment as a geomatics student and used survey data while drafting... but the fact that an open data movement was going on… I mean what’s Open Data anyways? I quickly learned that this was a big deal and a large global movement. As long as privacy laws are being followed, why not release the data right? It promotes innovation, empowers entrepreneurs and small businesses, and can potentially provided people with the building blocks to solve real issues.
During my co-op I had spent some time reviewing what my predecessors had accomplished as open data interns. There were literature reviews, spreadsheets, infographics, web maps, and of course, data. The SGRC and the Rural Development Institute (RDI) had done a data call out to 28 communities within the Columbia Basin Trust along with the 4 regional districts that fall within the Trust. Memorandums of Agreements had been sent to all 28 communities and 4 regional districts. Some examples of data requested were; zoning, property taxes, infrastructure mapping, floodplain mapping, and high resolution contours. We received quite a bit of data. However, everyone does data differently. A lack of standardization makes data sharing pretty challenging.
A previous co-op student had inventoried the delivered data and rated the quality of its geometric completeness and its metadata. I found this helpful but realized there was also the issue that some of the smaller communities probably don’t have digital versions of the data requested. Therefore, no data was delivered. At this point during my co-op I was asked to prioritize communities that should be contacted first in an effort to receive data. To do this, I cross referenced the online web maps and data catalogues with the data that had been delivered and constructed a rating system.
- High Priority (contact first) = No or very little evidence of digitized data via. web maps and data delivered.
- Medium Priority (contact second) = Evidence of data digitization but lack of delivered data and data availability.
- Low Priority (last to contact) = Good delivered data or good data availability.
Most of the regional districts have open data catalogues and web mapping portals. However, most of the smaller municipalities do not. Some data for the municipalities can be seen within the regional district web maps, but not all. These apparent “holes” in data availability tend to make things confusing. It launches the questions; does the data exist? And if so, in what format? Does the data need to be digitized? Is this a possibility? I’ve learned that streamlining data delivery is not an easy process. However that is not to say that we shouldn’t try!
I learned a lot working for the SGRC and am confident that the skills that I have learned here will benefit me in my future endeavours. I was happy to do a couple different projects as it diversified my experience and allowed me to exercise a range of freshly learnt skills. Working with the Open Data Project was very interesting and eye opening. I am completing this co-op with a strengthened understanding of the importance of data standardization and good metadata (any metadata at all?)! I also learned the very valuable lesson that if you delete a feature class it is gone forever…unless of course it is available through an open data catalogue! However, if you do any editing in ArcMap, back up your work before you go all crazy “cleaning up” your working geodatabase.